Revenue Report
Overall revenue for a date range, grouped by day, week, month, or year
Revenue Report
 Click to enlarge
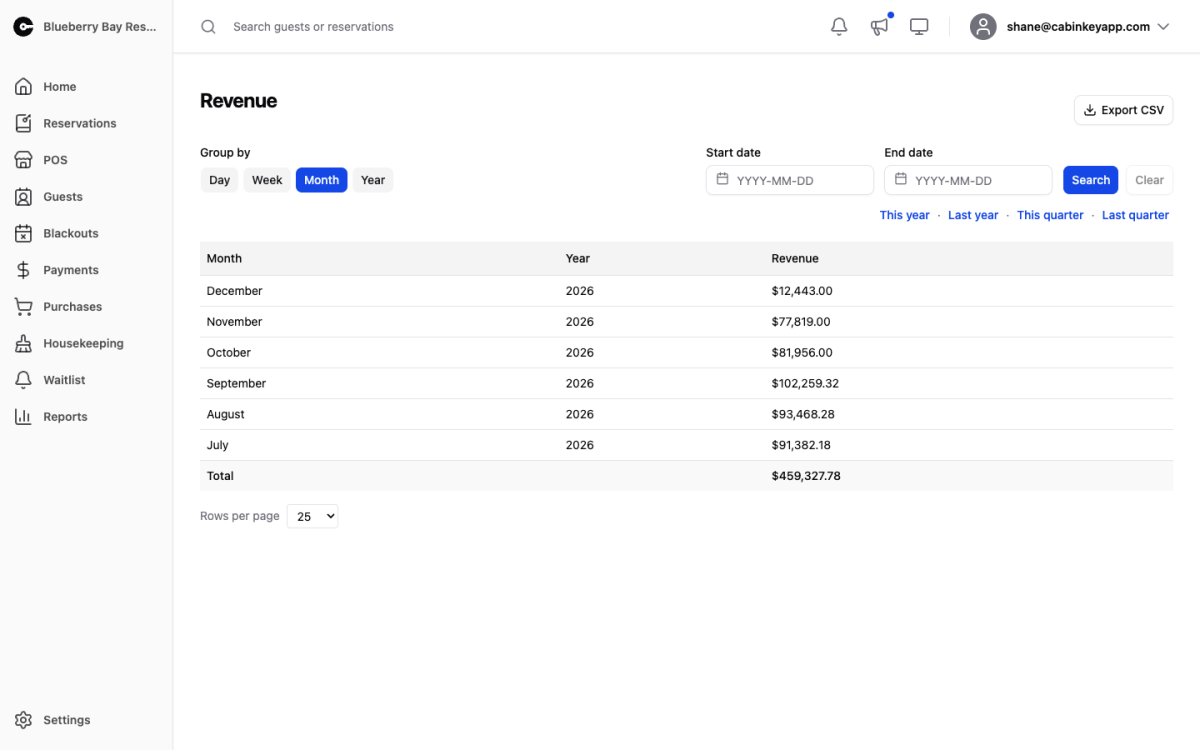
Total revenue for the property over a date range. This is the top-line number — everything you earned, from unit stays, add-ons, sale items, and fees, net of discounts, with taxes accounted for.
Start here when you want to know how a season went, then move to Unit Revenue, Addon Revenue, or Sale Item Revenue to see where the money actually came from.
Filters
 Click to enlarge
The same controls appear on most reports:
- Group by sets the row granularity: Day, Week, Month, or Year. Day and week answer “which nights sold”; month and year answer “how is the business doing”.
- Start date and End date bound the range, then Search runs it. Clear drops the range and goes back to the default.
- The shortcuts below the dates — This year, Last year, This quarter, Last quarter — fill the range for the windows you file against. Quarters are calendar quarters, and all of them are relative to today’s date in your property’s timezone.
Report Table
 Click to enlarge
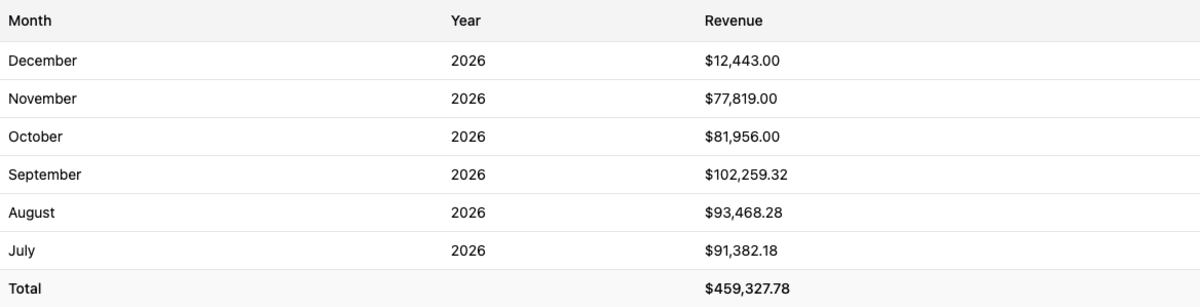
One row per period, with the leading columns matching the grouping you chose — a daily report breaks out date, month, and year so it stays sortable and readable.
Totals are summed across the whole range, not just the page you are looking at, so paging through a long report does not change the number at the bottom. Export CSV exports the range you filtered, not the visible page.