Utilization Report
Occupied versus vacant nights, by unit
Utilization Report
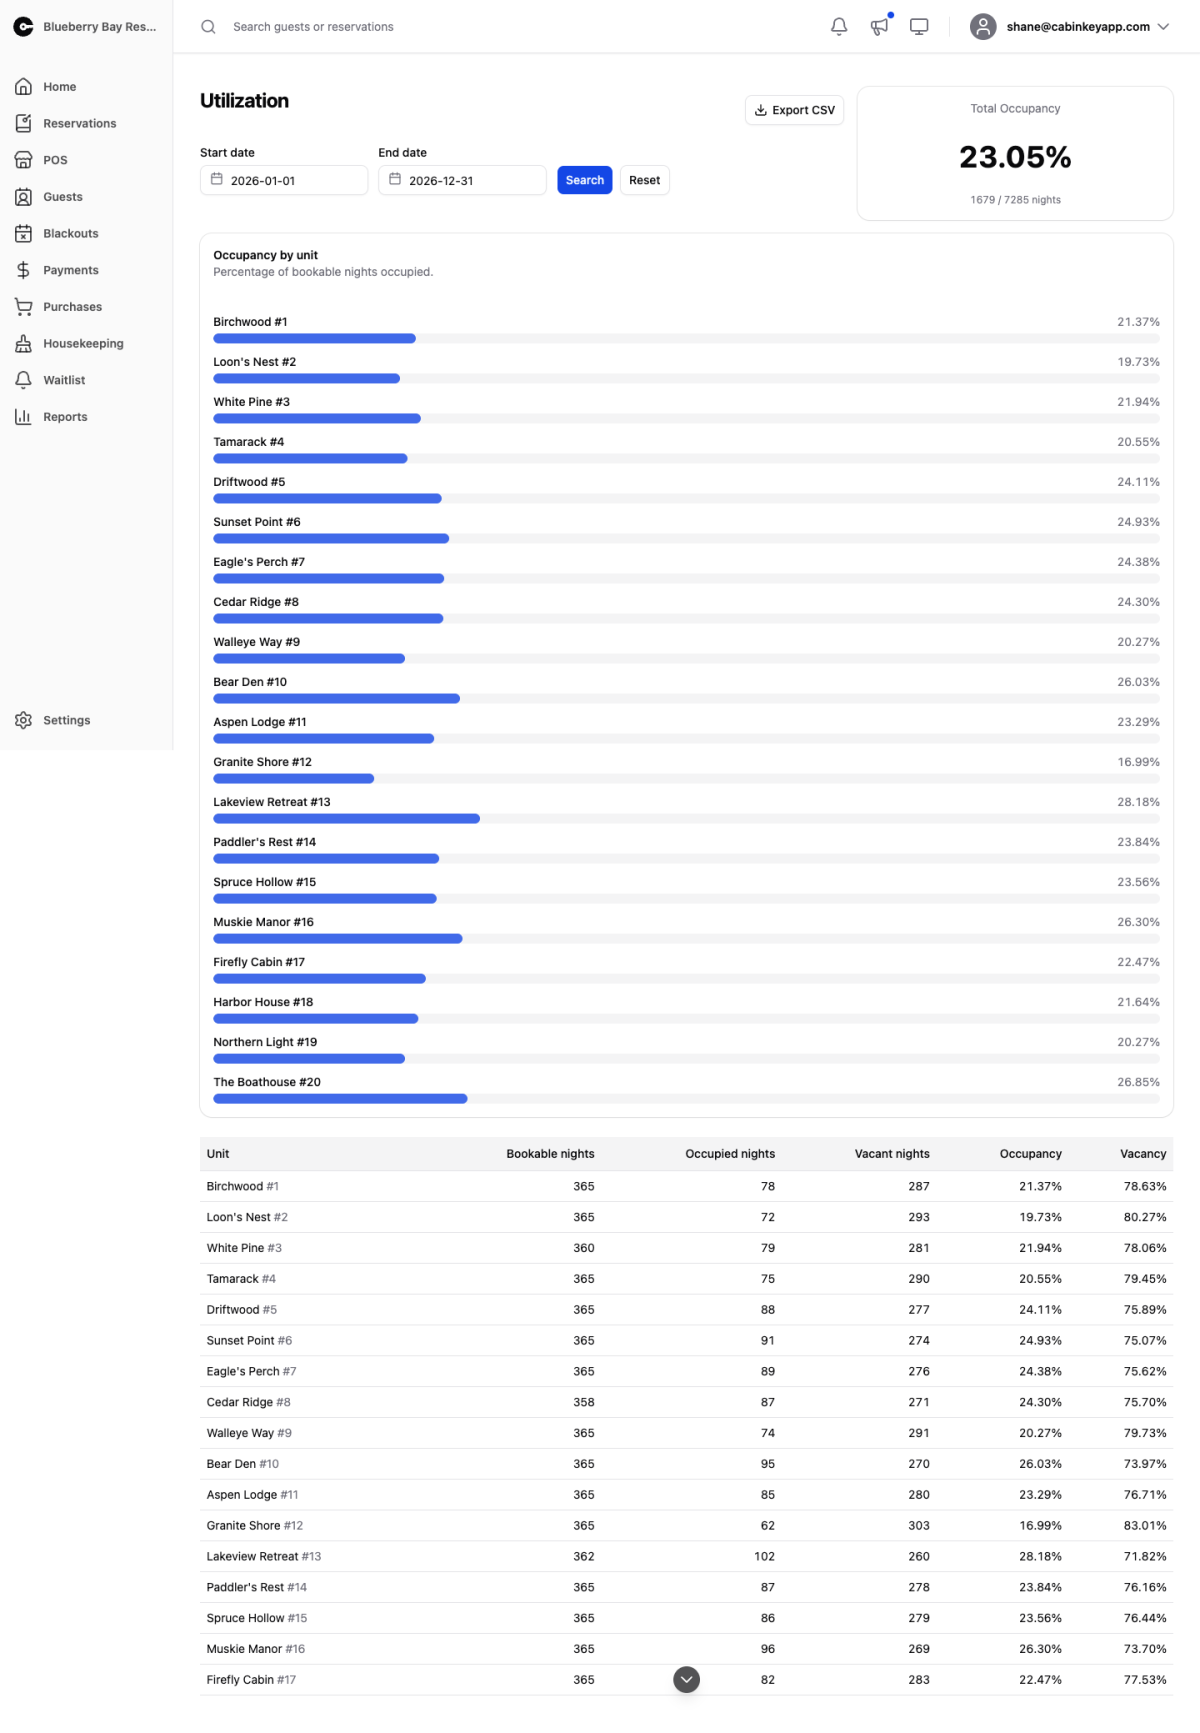 Click to enlarge
How full you actually are. Revenue tells you what you made; utilization tells you how much of what you had to sell you managed to sell.
A headline Total Occupancy figure sits beside the filters, showing the percentage and the underlying night count — occupied nights over bookable nights — so you can see whether a percentage rests on a large or small base. Set a start and end date and Search; Reset clears back to the default range.
A bar chart above the table ranks units visually, which is usually the fastest way to spot the outlier.
Report Table
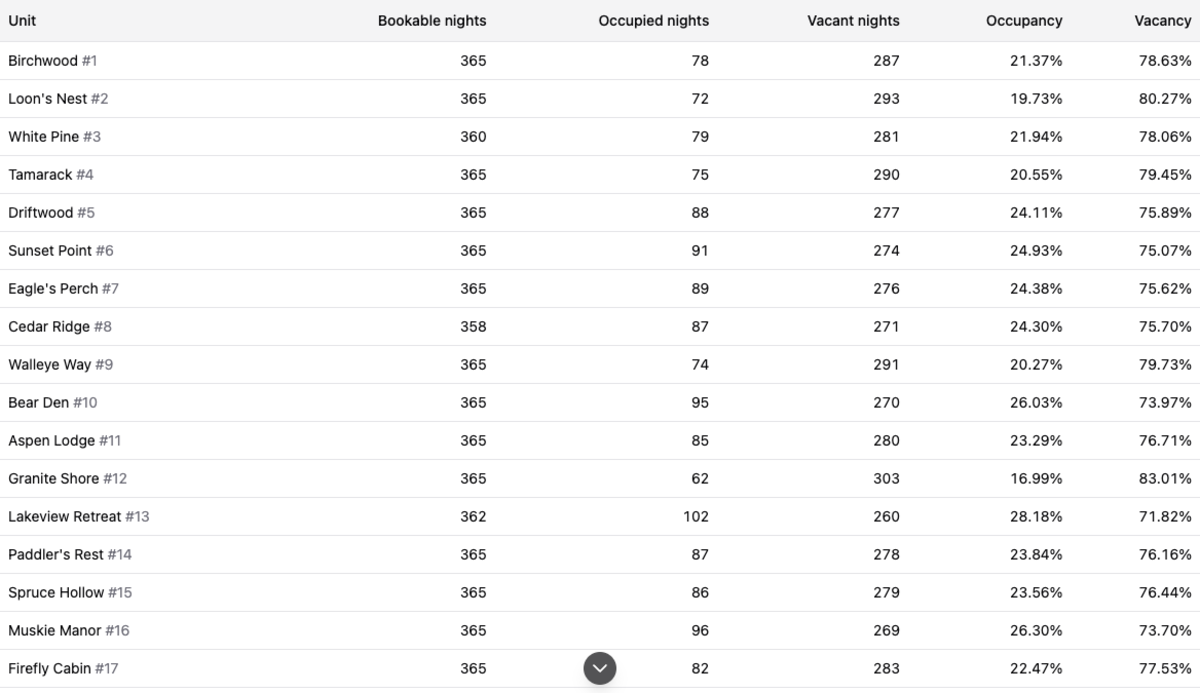 Click to enlarge
One row per unit:
- Bookable nights — nights the unit was actually available. Blackouts come out of this, so a unit closed for repairs is not punished for the nights it could never have sold.
- Occupied nights and Vacant nights — how those bookable nights went.
- Occupancy and Vacancy — the same split as percentages.
Because blackouts are excluded from the base, low occupancy here is a real demand or pricing signal rather than an artifact of closing a unit.
What to do with it depends on the pairing with Unit Revenue:
- High occupancy, low revenue — the unit is underpriced. Raise the rate on the daily calendar or its rate plan.
- Low occupancy, high rate — you are priced above what the market will take for that unit.
- Low occupancy across every unit in the same weeks — that is a slow period, and a better target for a length of stay tier or a discount rule than a permanent rate cut.